To be honest, this was a lot more time consuming than I thought it would be. But, I'm glad I got it done. First thing to note with this 3S model is that it was designed specifically to integrate with a DCF Valuation, which will be shown in the next blog post.
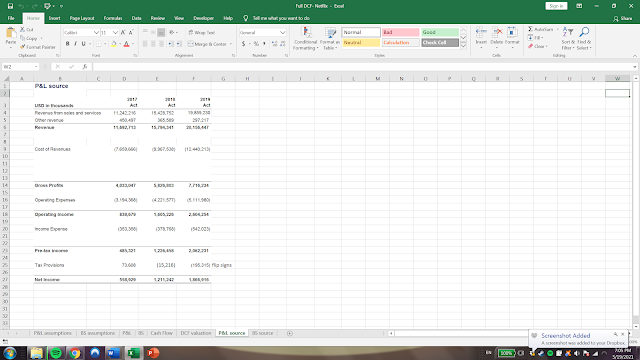
For the P&L source, I downloaded the 2019 10-K form from Netflix's website, and translated their income statement onto Excel. For the BS source, I had done something similar. I had separated the assets into two categories: Fixed assets (PP&E, Other non-current assets, Non-current assets) & Non fixed assets (Current content assets, Other current assets, and Cash and equivalents), these two summed together to form Total Assets. On the liabilities side, I summed up all of the components of Liabilities from the BS and added together Total Equity to get Total Liabilities & Equity.
With both sources firmly established, I could start working on the assumptions sheets. I started with the P&L assumptions, where the key values that I wanted to forecast were: Total Revenue, Cost of Revenue, Operating Expenses, Net non Operating interest income expense, Tax provision,Cogs (I didn't implement Cogs into my P&L), D&A, and Interest Expense. Forecasts were determined by historical growth rates such as % of revenues for most values, y-o-y growth % and % of pre-tax income for Tax Provision. I created a switch cell, so that I could switch between a Best, Base, and Worst case scenario. I linked the 3 types of percentages with the switch cell by using the CHOOSE function, which allowed me to easily switch between the 3 different cases. For BS assumptions, I decided to stick with a Base scenario, which was the average of the historical growth rates for the different values. I decided to do this because the majority of growth rates for the BS values are dependent on the forecasted values for revenues. One of the difficulties I encountered was that I couldn't find values for Inventory and Trade Receivables, thus I couldn't forecast future values for either of these values or include them in my BS.
I structured the P&L by following Netflix's P&L statement on their 10-K. I imported the values from P&L assumptions using the SUMIF function. For Cost of revenues, I translated them from the different sheets since SUMIF didn't work. For the BS, I had used SUMIF again. For the forecasted values of Cash and cash equivalents, I calculated the negative difference between forecasted Total Assets and forecasted Total Liabilities and Equity. This balanced out the forecasted BS; however, I feel like this was the incorrect way to do it. I have to learn how to properly calculate forecasted Cash and cash equivalents.
For the CF, I started with Pre-tax income (EBT) and added back D&A, Interest Expense, and Other non-operating expenses, in order to end up with EBITDA (Earnings before interest taxation depreciation and amortization). I subtracted D&A from EBITDA to get EBIT. I multiplied Proforma Tax rate (the given tax-rate and the forecasted tax-rate, which is a fixed value of -9%) by EBIT to get the Proforma taxes. I subtracted the Proforma taxes from EBIT to get NOPAT (Net operating profit after tax). To calculate Capital expenditures, I subtracted PP&E for year 2 by P&E for year 1 and added back D&A for year 2. For Investments in Working Capital, I subtracted Current assets by Current liabilities. I think in Netflix's case this is (Current content assets + Other current assets )- ( Current content liabilities+ Trade payable+ Accrued expenses and other liabilities). To get Free cash flows, I added all these values and D&A back into NOPAT. Overall, I think CF statement was the most challenging to make for me, so it likely has the most errors.
For my next post, I will explain my DCF valuation for Netflix using the FCF values I calculated.
Here is my full 3S with the DCF included:
All Relevant Tables:
Netflix P&L Source
Netflix P&L Assumptions
Netflix P&L
Netflix BS
Netflix CF


Comments
Post a Comment