
I plan to broaden my horizons after this post, and start investigating other types of valuation like Multiples. Also, I intend to do an LBO later down the road. I've decided to change up the presentation of these blogs by incorporating screen-shots, instead of linking to the Excel file. This not only introduces a visual element to the blog, but also assists in explaining my steps.
First of all, I downloaded the 2019 and 2020 10-K's of Apple. In order to improve the ease of inputting information, I made a P&L and BS source page. For the P&L source sheet, I subtracted the total revenues from 2018-2020 by the cost of products sold for each respective year. This results in Gross profit. By subtracting Gross profit by Operating expense, we get Operating income/EBIT. Interestingly enough, instead of finding something titled ' interest expense', Apple in their Operations statement had a value called ' Other income/expense' , which performs the same function of subtracting from Operating income to get EBT. By subtracting income taxes from EBT we get Net income, which will serve as the final result in our P&L.


For the BS assumptions, I made a presumption about how Term debt would look like in the forecasted period. I used y-o-y growth % to determine the forecasted values. I'm not completely sure if this is the right approach. There is a possibility that I could have used the % of revenues method to determine the forecasted values, or even another method all together. I used the Days method to forecast the future values for Inventories, Accounts payable, and Accounts receivable. The Days method involves dividing the formerly mentioned values by either Total revenue (Accounts receivable) or Cost of products sold (Accounts payable and Inventories), and then multiply that by 365. By doing this you get the % growth rates that will determine the forecasted values. To get the forecasted values, you multiply those growth rates by either revenue or cost of products sold and then divide by 365. I used the Choose function for the forecasted term debt in order to give a more multifaceted answer.

Filling out the P&L was easy enough, as I used the Sumif function to copy the values from the assumptions sheet onto the main P&L sheet. Sumif works like this: = SUMIF( column from data source that contains all value names, cell in main sheet that contains the name of the value you want, column from data source that contains the values you want to copy). For the first two aspects, make sure to keep the columns fixed.

For the BS sheet, I either used Sumif or just copied the necessary cells from the BS source sheet. For the forecasted values of Shareholders' equity, you add the previous year's equity value with the current year's forecasted net income. For the forecasted values of Cash and cash equivalents, you add the previous year's cash with the current year's net cash flow (this is calculated in the Cash flow statement).
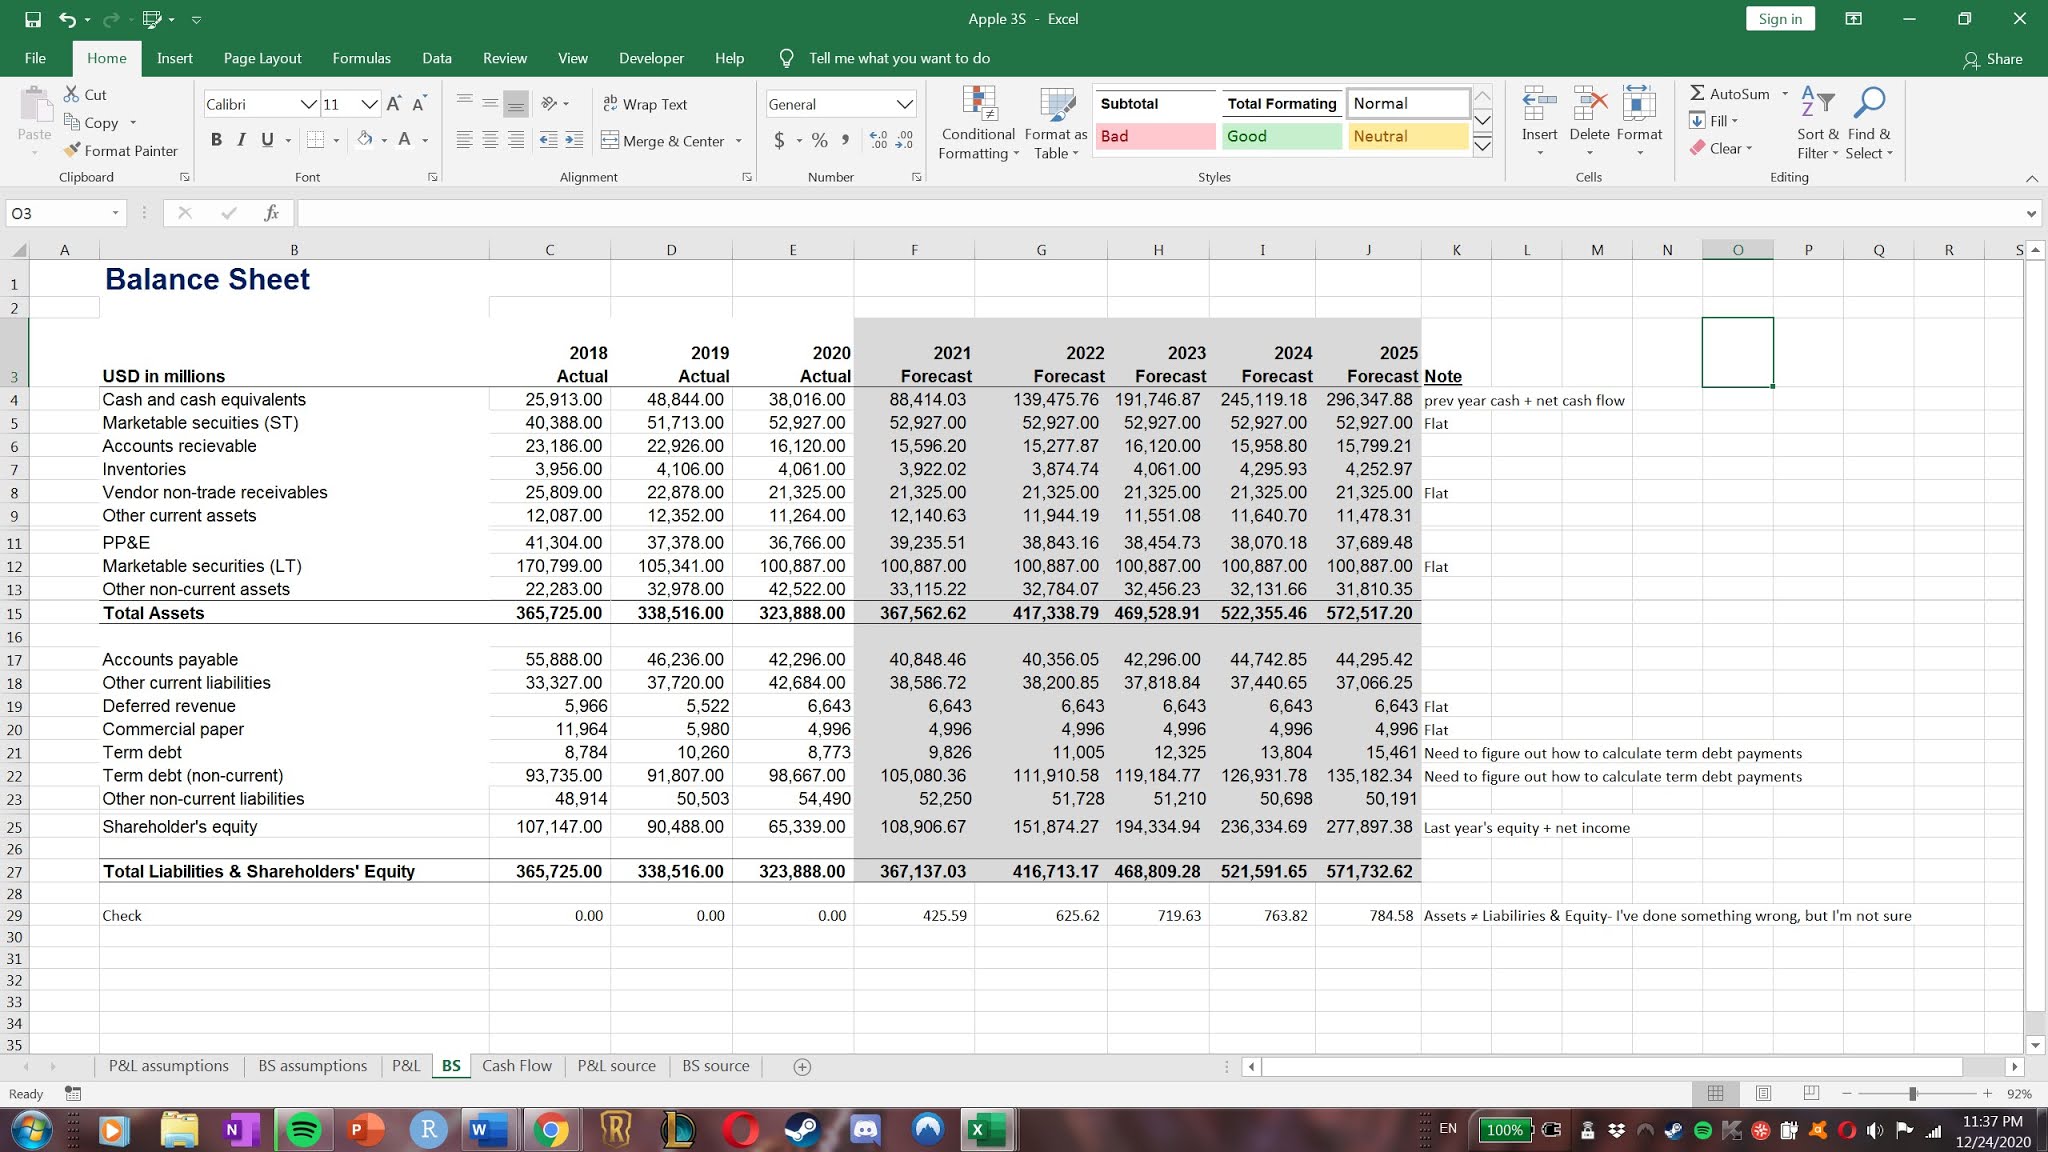
The Cash flow statement was by far the most difficult part of the 3-statement overall. I had to make quite a few assumptions which affected the accuracy of the 3-statement. However, when looking at the BS check ( Total Assets= Total Liabilities & Equity), the forecasted values almost line up. The difference between total assets and total liabilities and equity is quite minimal; however, because of this minimal difference I know that there are inaccuracies in my model. Also, not knowing how to exactly forecast term debt will definitely yield some inaccuracy in my model.
Now, I will explain some specific values in the CF statement. Using the tax-rates from the P&L, I calculated the Operating taxes, which are the taxes relative to the EBT, unlike in the P&L where the taxes where relative to the EBT. For assets like Inventories & Accounts receivable, I got the negative value of their differences i.e. -(year 2 value - year 1 value) and for Accounts payable, I just calculated their differences. Investments in WC is just the sum of the Inventories, Accounts receivable and Accounts payable values. Capex is the negative difference of the PP&E values i.e. -(year 2 value - year 1 value) - D&A for year 2. Current assets/liabilities is the negative difference of current assets plus the difference of current liabilities: -(year 2 current asset value - year 1 current asset value) + (year 2 current liability value - year 1 current liability value). The same method was performed to compute Non-current assets/liabilities. I didn't consider Marketable securities and Vendor non-trade receivables as financial obligations so I computed the negative difference between all these values and inputed them in the CF in order to calculate the Unlevered free cash flow (UFCF). The UFCF is the Gross cash flow subtracted by Investments in working capital, Capex, Current assets/liabilities, Non-current assets and liabilities, Vendor non-trade receivables, and Marketable securities.
For Net cash flow (NCF), I subtracted UFCF by Other income/expense from the P&L, Delta taxes vs operating taxes ( the difference between EBT taxes and EBIT taxes), Delta Equity ( year 2 equity - year 1 equity - year 2 net income), and the differences in year 2 and year 1 values of: Term debt, Commercial paper & Deferred revenue. The Term debt, Commercial paper, and Deferred revenue values where included based on assumptions, as I think these values all serve as financial obligations that Apple as a business have to pay off eventually.

With that, I've concluded my break down of the Apple 3S. For the next blog, I plan on conducting a DCF analysis on Apple using the 3S as my basis for valuation.
Comments
Post a Comment