Introduction

P&L and BS Source
The source for the financial data of Activision-Blizzard from 2018 to 2020 was mainly Yahoo! finance and the company's 10-K for the years 2020 and 2019. I simply inputted the values to the corresponding year, to get a corresponding P&L and BS for the years 2018-2020. In terms of trends in the P&L, there has been a significant increase in Total Revenues from 2019 to 2020, where it goes from $6.5 billion to $8 billion. This increase in revenue seems to be part of the general part for the games industry in 2020, which saw a surge in revenue. MarketWatch even claimed that video game revenue surged 20% to about $179.7 billion. This surge can be attributed to the COVID pandemic keeping everyone at home, sparking more interest in indoor activities like video games and enabling people who were already engaged in the hobby to spend more time & money on it. Another aspect I found intriguing was in the company's BS, where we can see a notable increase in the long-term debt segment of total liabilities. Long-term debt has ballooned from $2.675 billion to about $3.6 billion. However, interestingly enough, the debt to equity ratio: Total Liabilities/ Total Shareholders' Equity, decreased from about 0.55 to 0.536. This was due to the increase in retained earnings. Without industry context, Activision-Blizzard's D/E is meaningless, so it should be compared to its competitors. Activsion-Blizzard's biggest competitors are Take-Two Interactive & EA, who have a D/E of 0.94 and 0.489 respectively. Therefore, it seems like Activision-Blizzard lives in a happy middle ground between the two. If anything, this raises a red-flag for Take-Two Interactive, whose ratio is 0.94. In regards to Activision-Blizzard, perhaps due to COVID, they capitalized more on debt financing in order to fuel their operations. Overall, it is difficult to determine whether the increase in long-term debt is a good or bad sign.


P&L and BS Assumptions
The P&L and BS assumptions sheet is quite straightforward. I created a switch cell using the choose function, in order to switch between a best, normal, and worst case scenario for the P&L. It should be noted that I assumed flat values for the Net Non Operating Interest Income Expense & the Other Income Expense. I assumed flat because of the seemingly sporadic change of net income expense. It dropped to 11 in 2019, but picked back up to 78 in 2020, which is similar to its value in 2018. The later value of other income expense is flat because its growth rates were too random for me to pinpoint three different case scenarios. I decided to go with a flat value of 300, because other income expenses were increasing year after year, but I don't think it was right to assume a sustained increase that would yield an astronomical figure.
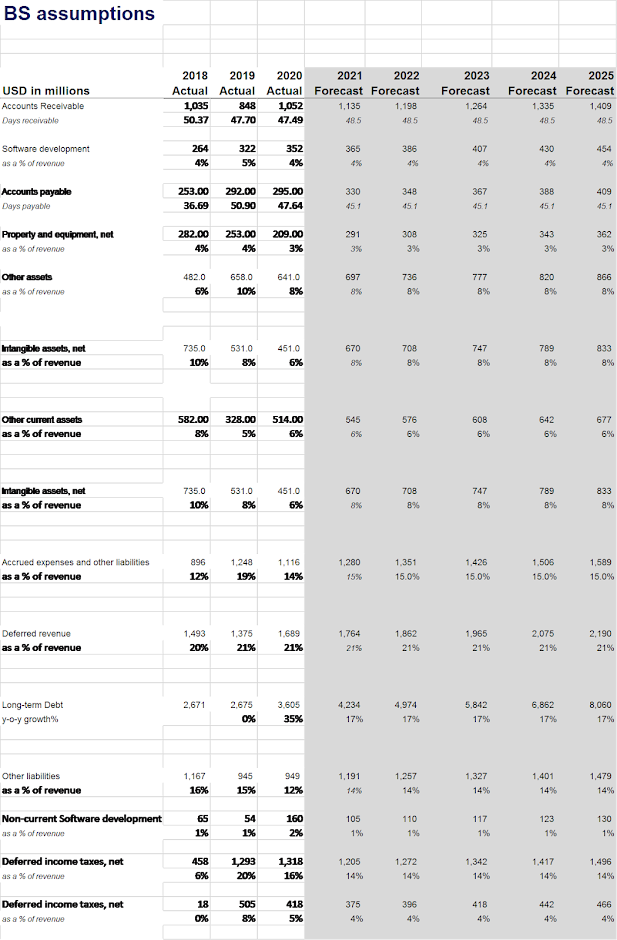
The BS assumptions sheet was rather straight forward. Instead of having three different case scenarios, I decided to just use the average growth rate values, since the model would get too complicated, in my opinion.

P&L and BS- Fixed Assets Roll Forward
I copied the values from the assumptions sheets to the forecasting sheets via the SUMIF function. SUMIF allows a user to collate a sum of data from a specific column. This was convenient, given how I arranged my data in the Assumptions tables.
In terms of patterns in my forecast, I'll start with the P&L forecast. The main pattern to note (average case) is that after 2020, Net Income takes a slight dip. It goes from $2.197 billion to $1.939 billion. This is primarily because of how the percentage growth of Cost of revenue & Operating Expense far exceeds that of Total Revenue. The reason why that is because from 2018 to 2019, Total Revenue falls from $7.5 billion to $6.5 billion, which corresponds to a -13.48% growth rate. Another potential reason for the Net Income decline into 2021 could be that as COVID winds down in countries like the US, video game spending will decline, as people gain the ability to go out and be outside with friends and family. For the best case scenario, the P&L forecast shows that Net Income increases steadily year after year. This is partly due to the Total Revenue growth rate being 9.6%, which is significantly higher than the base growth rate of 5.6%. This is plausible since the video game industry has been growing significantly year after year, with a 20% growth in 2020 to reach an industry revenue of $175 billion.
Note I haven't properly balanced out my BS. Regardless of which case scenario is chosen, there will be a difference between Total Assets & Total Liabilities and Shareholders' Equity. As I continue practicing and improving my finance skills, mistakes like this will become a thing of the past.
Looking at trends within the base case of the BS, one that stands out is the continuously decreasing PP&E. Considering the year after year decreases of PP&E, I made my Fixed Assets Roll Forward have a continuous decrease in PP&E as well. There is of course the issue of the historical trend not being the precedent for Activision-Blizzard's future PP&E. However, that is the main limitation of using historical values to make projections for the future. Another fault that I can see with my Fixed Assets Roll Forward is that I should have decreased PP&E at a greater rate. The reason why the forecasted PP&E seems more lenient is because I determined the future Capex & D&A values with the average of historical Capex & D&A as a % of Beginning PP&E. For future reference, i should definitely research more methods of forecasting Capex and D&A in order to have a broader approach in forecasting PP&E values.


BS - Equity Schedule & Financial Liabilities
Looking at the Equity Schedule, which determines the forecasted Shareholders' Equity values, there is a clear increasing trend year on year. As can be seen from the historical Shareholders' Equity, we can see it increasing significantly from $11.392 billion in 2018 to $15.037 billion in 2020. Before starting the Equity Schedule, I glossed over the historical dividend payments in Activision-Blizzard's 10-K, which can be at the bottom of this post. On page 64, it can be seen that dividends increase by about 25-35 each year. In 2018, it is (259) and it increase in 2019 to a value of (283), which is an increase of 24. From 2019 (283), it increases to (316) in 2020, which is an increase of 33. I ensured that this historical pattern would be met when forecasting future dividends. This was done by using dividends as a % of Net Income to forecast the future dividend values. Using this value as the growth rate for future dividends, I obtained a value of around 20% for the dividend growth rate year after year. I incorporated this growth rate into future dividend growth and was able to obtain an increase of around 30 each year. Using an IF statement, I made sure that if the Net Income value was greater than 0, there would be a dividend proportional to about 20% of that corresponding year's Net Income.
Before talking about the Financial Liabilities sheet, it is necessary for me to say that this section if the 3-Statement has the most speculation behind it. On Page 86 of Activision-Blizzard's 2020 10-K, Activision-Blizzard states that they have "no contractual principal repayments of our long-term debt within the next five years". From what I understand, this means that they have no schedule to pay the principal amount of their debt amount for the next five years. Because of this, I was stuck on whether I should even make a Financial Liabilities schedule for the company. Ultimately, I decided to do the schedule anyway. In my debt schedule, I used an interest of about 2.76%, which is the average of the interest rates for the 2021, 2022 and 2026 notes. One thing that stood out for me is that Activision-Blizzard's principal payments were significantly higher than the values I calculated using the PMT function. My principal payments went from around 70 in year 1 to around 180 in year 20. However, Activision-Blizzard showed their principal going from around 650 to 1500. Clearly something does not add up. Likely, this debt schedule is a major contributor to why my BS isn't properly balanced.


Cash Flow Statement
With an increasing Net Income, it would make sense that the firm's Operating Cash Flow would be increasing as well. However, that is not always true, as can be seen for the 2022 value. This also applies to 2022's Net Cash Flow. When looking at the table carefully, this can be explained by the fact that both Change in Other Liabilities value & Change in Trade Payables values are rather low in comparison to the other years. Other than that as the years go by in the forecast, the Operating and Net Cash Flow increase, mostly due to the significant increase in Net Income as years go by. It should be know that this is in the base year example. In the best case scenario, there is no hiccup in Cash Flow, as in 2022 the value is larger than the previous year. In the worst case scenario, the Net Cash Flow continues to decrease year by year. This is mostly due to the notable decrease in the Change in Other Liabilities value as well as the Capex value.

Conclusion
There are definitely faults with my financial model: not knowing how to accurately forecast D&A, and not having a balanced Balance Sheet. If I had more time, I would improve my model to more accurately forecast D&A as well as understanding why my Balance Sheet wasn't properly balanced. To conclude, I feel that this was a comprehensive, but still flawed analysis of Activision-Blizzard.
Activision 2020 10-K: https://investor.activision.com/static-files/3b112079-07bb-441b-bf26-9cb062f12139
Activision-Blizzard 3-Statement: https://docs.google.com/spreadsheets/d/e/2PACX-1vQdvph_udCkQeN57oo4kuhlEPPnoWiH_HmWAKQFm3MtpIv7WqV_jQ0ls5pEpmcPrFJlXmOpc4YYqhRk/pubhtml
Comments
Post a Comment